These charts and graphs offer great ways to visualize data that might otherwise be confusing, so it’s only natural that you would want to use it in other places, too. Our tutorial below will show you how to turn an Excel chart or graph into a picture that you can share with other people, or include in other documents.
How to Save a Chart in Excel as an Image
Our guide continues below with additional information on saving an Excel chart as a picture, including pictures of these steps. Microsoft Excel has a lot of tools to perform calculations and edit or display data in useful ways. One such option is to select a range of cells and use that data to create a chart or a graph. But if you have ever tried to save only that chart or graph as a picture so that you could share it or use it elsewhere, then you may have run into a problem. The steps in this article are going to show you how to create an image file from a chart or graph in one of your Excel files using Excel 2016. Excel has many uses for managing and manipulating data, including the ability to generate charts or graphs from the data in your spreadsheet. Sometimes these charts or graphs are merely additional features, and the data itself is the main focus for you and other readers, but occasionally the chart or graph may be the only part that’s necessary. If you have a chart or graph in Excel and you would like to save it as an image to use in another application or to share with others, then it’s possible to copy the Excel chart or graph and paste it into an image program, then save that file. Related Article: There is a way to quickly convert your cell text to all capital letters. Check out our make all caps in Excel tutorial for more information.
How to Use Microsoft Paint to Create an Image File from an Excel Chart or Graph (Guide with Pictures)
The steps in this article were performed using Microsoft Excel for Office 365 and the Windows 10 version of Microsoft Paint. If you are using Windows 10, then you have Microsoft Paint. If you would like to use a different image-editing program, then you will need to use the pasting and saving options for that program instead of the ones in this guide.
Step 1: Open the Excel file containing the chart or graph you wish to save.
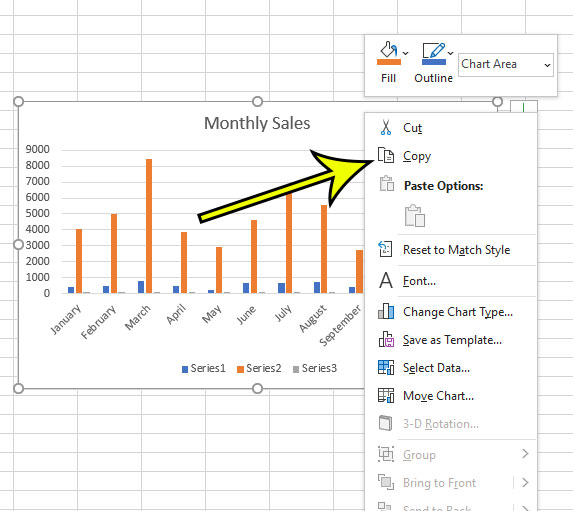
Step 2: Right-click in an empty space on the chart or graph, then select the Copy option.
Step 3: Open Microsoft Paint.
You can either click the Start button and scroll down to Paint, or you can click the search icon in the taskbar, type “Paint” then press Enter.
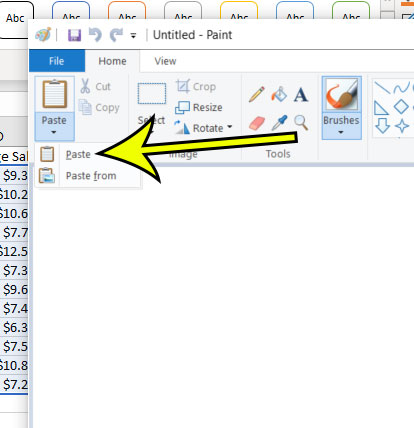
Step 4: Click the Paste button at the top-left of the window, then select Paste.
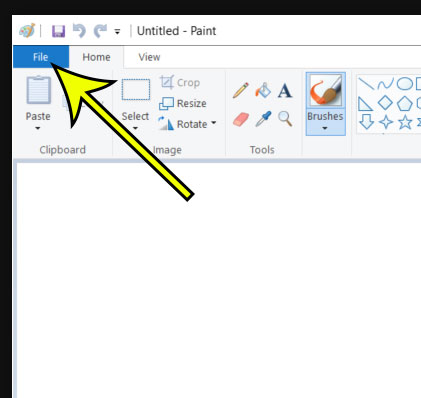
Step 5: Select File at the top-left of the Paint window.
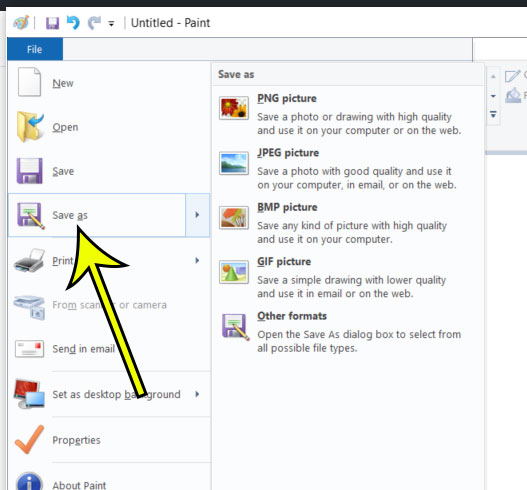
Step 6: Click on Save As, then select the type of image you wish to use.
If you’re unsure, then PNG or JPEG are usually the best options.
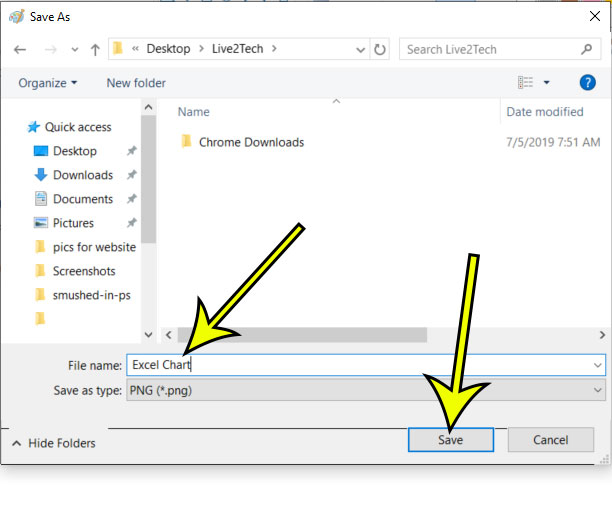
Step 7: Give the file a name, then click Save.
Now that you know how to complete the Excel export chart as image steps you will be able to use your excel graphs and charts in other places aside from your worksheets. Find out how to download a chart or graph from Google Sheets if you also use that application. It’s actually quite a bit easier in Google Sheets, so you may prefer that option if you use both programs.
More Information on How to Save an Excel Chart as an Image
In this guide, we focused specifically on how to copy and paste a chart from Excel into Microsoft Paint. The Paint application is included in every Windows 10 installation by default, which makes it a simple solution when you need to create images. However, since you are copying the chart or graph to the system clipboard, you can also paste it into other image-editing applications like Adobe Photoshop, or you can paste it into something like Microsoft Word or Microsoft Powerpoint. An image saved from Microsoft Paint behaves in the same manner as any other file that you save to your computer. If you want to include your graph image in an email, for example, then you would simply need to open your email application, select the option to add an attachment, then find the graph image in the folder where it was saved. For the sake of simplicity, I like to save my images in the Pictures folder, but you might find it more convenient to use the Documents folder or the Desktop. When you save Excel files, the Excel charts in those files are saved as well, assuming that you have chosen to save the workbook as one of the Excel file types, such as .xls or .xlsx. If you choose to save it as a CSV file or a Web page, then you will want to save the chart as an image as we did in the guide above. Some of the graphs or charts that you create in Excel are going to have a much simpler option to save the chart as image files. If you right click in an empty space on the chart, you might see a Save as Picture option near the bottom of the menu. If you select that option you can give the image file a name, then choose from one of the available image file types. This can be much easier than choosing to copy the chart using the press Ctrl + C option, then opening an application like Word or Powerpoint and choosing to Press Ctrl + V to paste it into the document. Note that when you export an excel chart as an image, it wont’ affect the chart in the spreadsheet. That will still be there for you to edit or display as needed with your workbook data. The image file that you create is simply a separate picture file that you can share with other people or use in other types of documents.
He specializes in writing content about iPhones, Android devices, Microsoft Office, and many other popular applications and devices. Read his full bio here.
